People are often confused by the ACT’s scoring system. Out of 36? How the heck does that work?
Sometimes the scoring can seem random. And in fact, there is some randomness involved in how your performance (the number of questions you get right) converts to a score out of 36 in each section of a given ACT test.
The first thing to understand about ACT scores is the difference between a raw score and a scale score. The raw score is simply the number of questions you get right in a section.
The scale score is the score out of 36. This is the one you see on your score report and the one colleges see with your application. It comes from your raw score. How? Well, there’s a lot of math involved. For now, just know that each raw score converts to a certain scale score.
Every ACT has a conversion table that shows what raw score converts to what corresponding scale score for each section. These charts are not equal for every test; your scale score is not calculated merely from the percentage of questions that you get right. On a test with somewhat harder questions, students are expected to get more questions wrong. This makes conversion chart for that test easier—as in you can get more questions wrong but end up with the same scale score. This means that even though the test feels harder, your score might not be so bad. On the other hand, if there is a tougher conversion chart, then you can get a worse scale score while getting fewer questions wrong. This means students can be punished more severely for mistakes. In short, the same raw score can convert to a different scale score on two different tests.
Let’s take a look at two ACT score conversion tables from ACT’s current official guide.
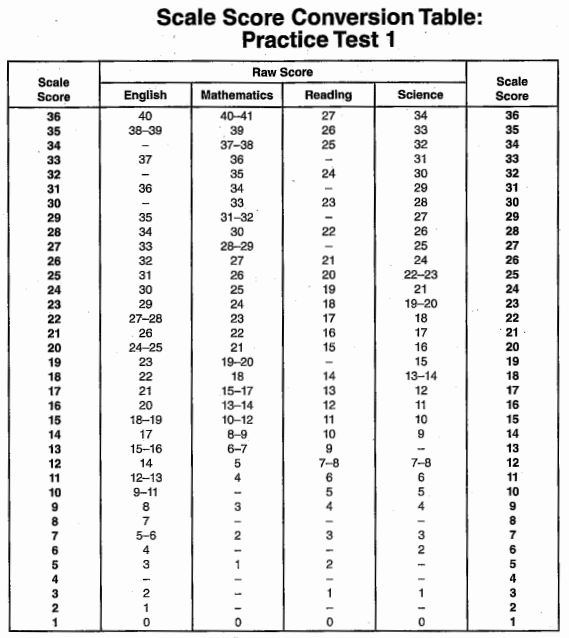
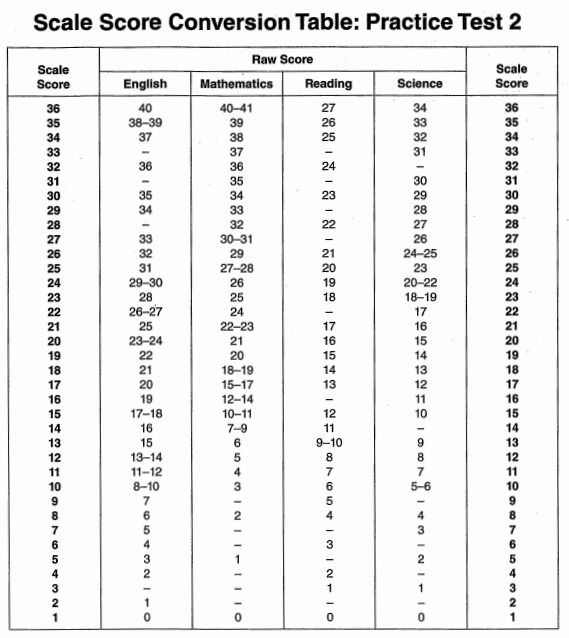
While the scales are quite similar, we can see differences. For example, on Practice Test 1, 37 questions correct yielded a score of 33, but in Practice Test 2, 37 questions correct yielded a score of 34.
This is where some randomness can come into play. Different tests can have easier or harder conversion charts among the four sections, depending on how many questions you answered correctly on that given test. Even on the same test, you may get one section with an easier conversion chart and another with a harder one. And the worst part? There is no reliable way to predict what sections will have a more difficult or easier conversion chart on a given test. The simple fact is that some students will do better on tests with easier conversion charts, and others will do better on tests with harder conversion charts.
So What?
What students should take away from this information is that every ACT is graded differently. In order for students to reach their maximum potential, they should take the test multiple times. There is no way to reliably predict what the curve of an ACT will look like for each of the four multiple-choice sections. Colleges only want to see the scores you choose to send them (for the most part), so keep trying until you’re happy with your score!
Taking the test multiple times is very important if you apply to colleges that superscore the ACT. For those schools, if you can get a favorable curve in even one section, you can improve your admissions chances solidly.
NOTE: the ACT is not necessarily trending toward more difficult curves in the Science section—that trend does not hold up when you move beyond this three-test sample.
Confused about scale score conversion? Frustrated with your ACT scores? Contact us to get some help today!